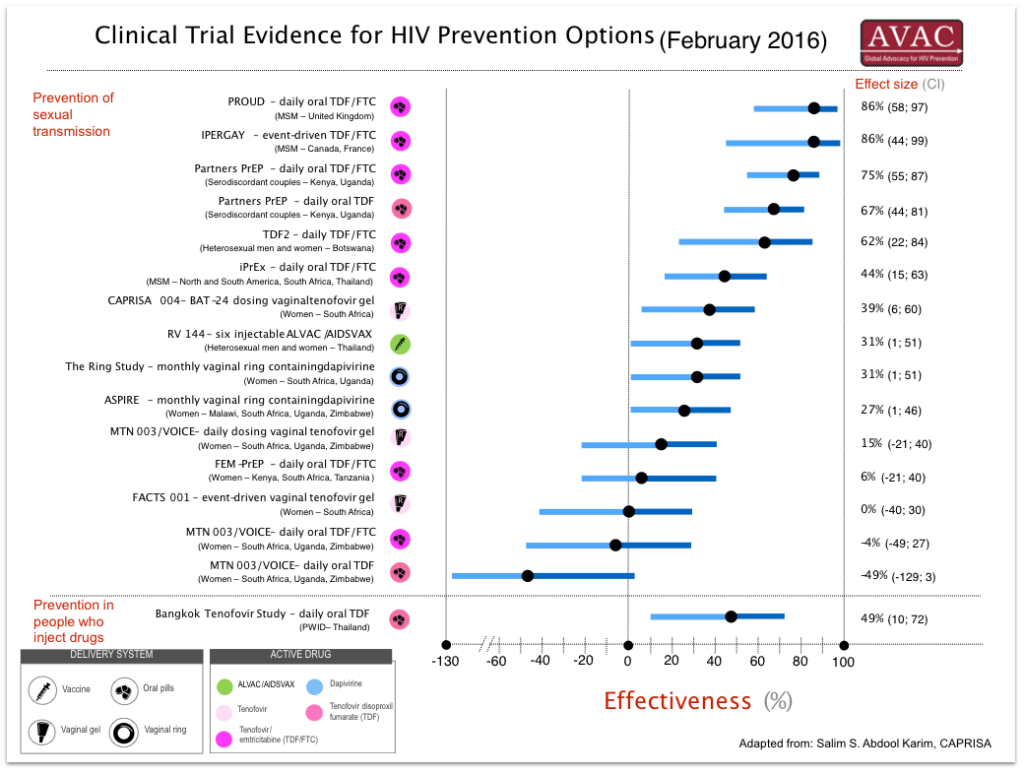
What’s the big picture of ARV-based prevention trial results? This graphic shows the levels of efficacy from each major trial (that’s the square icon) with the confidence intervals around the finding (the bars at either side). Not sure what a confidence interval is? See our one-page Advocates’ Guide to Statistical Terms. For PDF and JPEG versions, please click here.
Was this content helpful?
Tell us how we can improve the content.
Was this content helpful?
Thank you for your feedback!