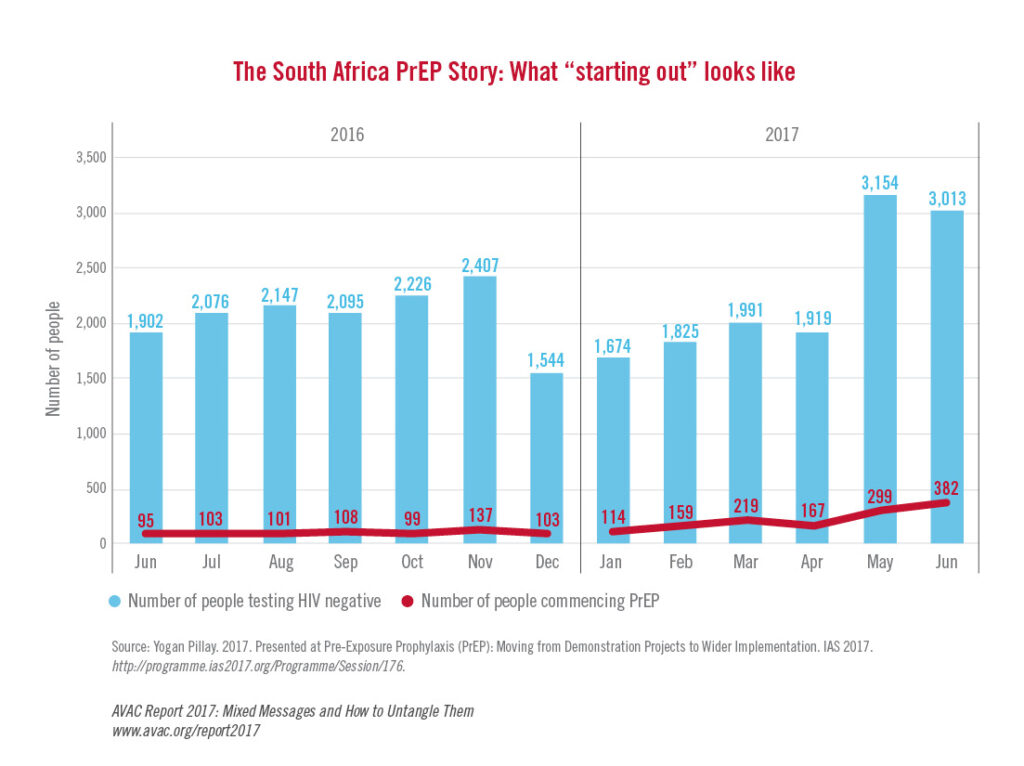
This graphic charts how many people in South Africa tested as HIV negative each month vs. how many people commenced oral PrEP from month-to-month. It appears in AVAC Report 2017: Mixed messages and how to untangle them.
Was this content helpful?
Tell us how we can improve the content.
Was this content helpful?
Thank you for your feedback!